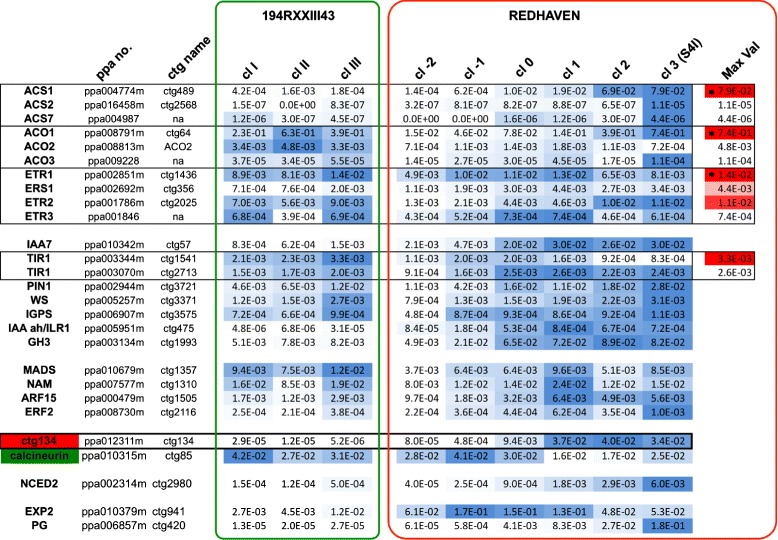
Fig. 5.

Absolute expression profiles of selected genes at the transition from maturation to ripening in melting flesh (Redhaven, RH) and stony-hard (194RXXIII43, RXX) genotypes. Gene groups and colors are as for Fig. 2 but for the last column (Max Val). As quantification was carried out with a standard, comparison of the relative abundance among members of the same gene family has been added (from white to red from the lowest to the highest, marked with an asterisk)
