
Figure 3.
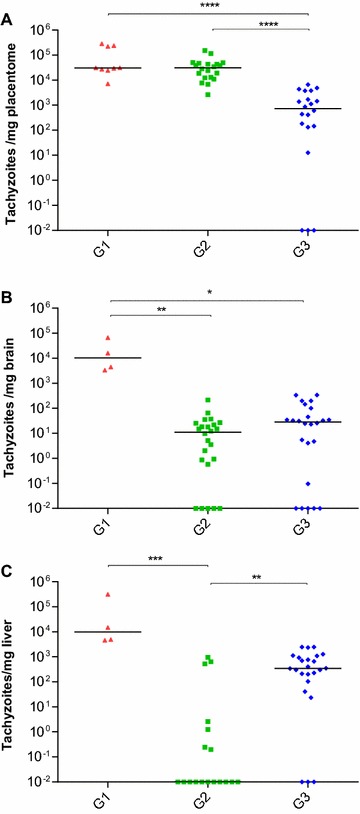
Dot-plot graph of N. caninum burdens. Parasite burdens were quantified by real-time PCR in the placenta (A), foetal brain (B) and liver (C) from animals inoculated with 106 Nc-Spain7 tachyzoites at days 40—G1, 90—G2 and 120—G3 of gestation. Data from G1 goats that aborted during the second wpi are excluded because they were mainly negative according to PCR detection (the only positive sample had a burden close to the detection limit by real-time PCR, 0.1). Each dot represents individual values of parasite burden (number of parasites per mg of host tissue), and medians are represented as horizontal lines. Taking into account that the N. caninum detection limit by real-time PCR is 0.1 parasites, negative samples (0 parasites) were represented on the log scale as <0.1 (i.e., 10−2). (*) indicates P < 0.05, (**) P < 0.005, (***) P < 0.001 and (****) P < 0.0001.