
Fig. 3.
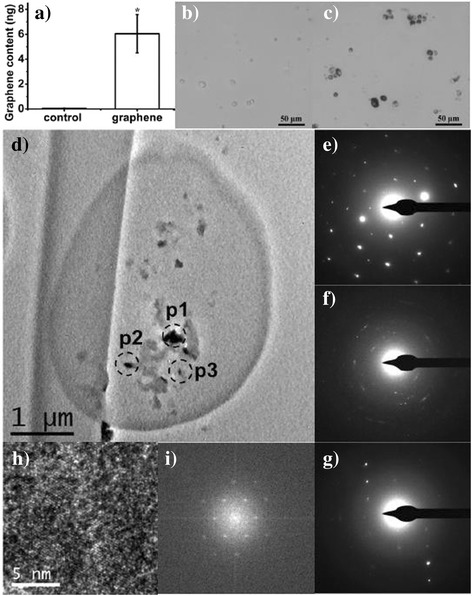
a FLG content in macrophages collected from the mice of the control experiment and FLG treated group (5 μg, 28 days), background radioactivity was subtracted; light microscope of macrophage collected from BALF of mice (b, control group; c, FLG-treated); d) TEM image of a whole BALF cell from FLG-treated mice; e), f) and g) SADPs taken from p1, p2 and p3 positions, respectively; h) High resolution TEM image taken from the p2 position; i) Fourier transfer spectra of Figure H. The symbol‘*’indicates values that differed significantly from the control group at P ≤ 0.05. Data are presented as mean ± standard deviation (n = 3)