
Fig. 5.
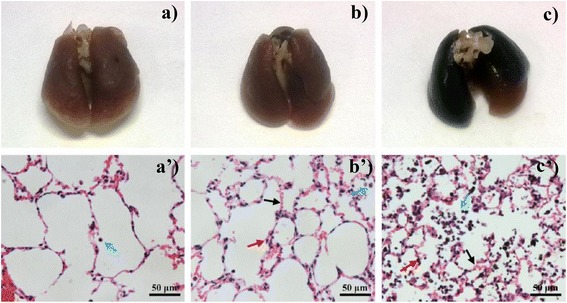
The morphological observation and representative H&E stained images of the lungs harvested 24 h post exposure (a and a’ control group; b and b’, 5 μg exposed dose; c and c’, 50 μg exposed dose). Sections were analyzed blindly and representative images selected from 6 mice per treatment group are shown. Blue arrows: cells in alveoli; red arrows: parenchymal; black arrows: interstitial edema