
Fig. 1.
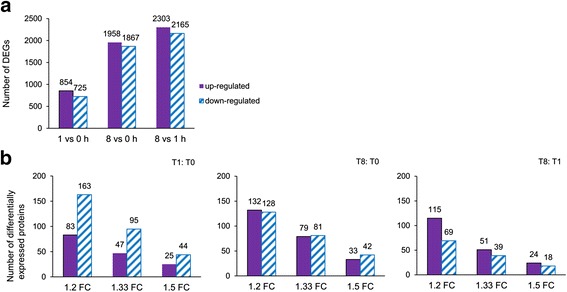
a Differentially Expressed Genes were shown in different groups. FDR ≤ 0.001, P < 0.01 and 2 FC. b Differentially expressed proteins in different groups. FDR < 0.001, P < 0.05 and 1.2, 1.33 and 1.5 FC were presented
Official websites use .gov
A
.gov website belongs to an official
government organization in the United States.
Secure .gov websites use HTTPS
A lock (
) or https:// means you've safely
connected to the .gov website. Share sensitive
information only on official, secure websites.
a Differentially Expressed Genes were shown in different groups. FDR ≤ 0.001, P < 0.01 and 2 FC. b Differentially expressed proteins in different groups. FDR < 0.001, P < 0.05 and 1.2, 1.33 and 1.5 FC were presented