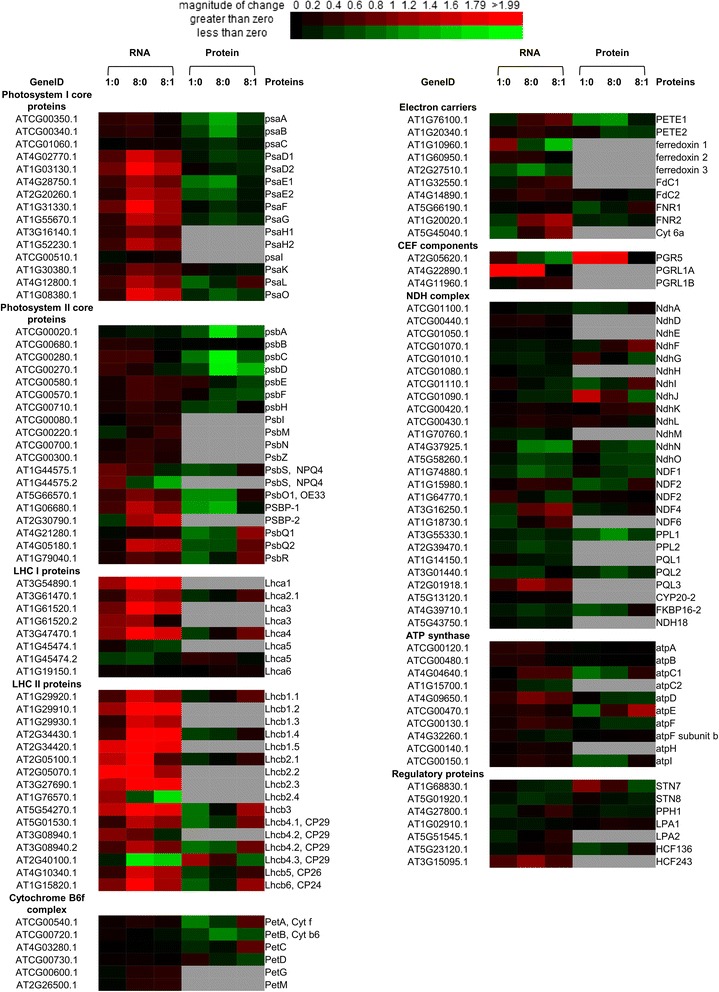
Fig. 2.

Heatmap of transcription and translation profiles of chloroplast photosystems at different time points. Each value was calculated by log2 ratio and colors were scaled per row with up-regulated in red and down-regulated in green. Missing data were represented by grey boxes. Heatmap was generated from http://bbc.botany.utoronto.ca/ntools/cgi-bin/ntools_heatmapper_plus.cgi. Ratios of (T1:T0, T8:T1 and T8:T0) are compared between each two time points
