Fig. 2.

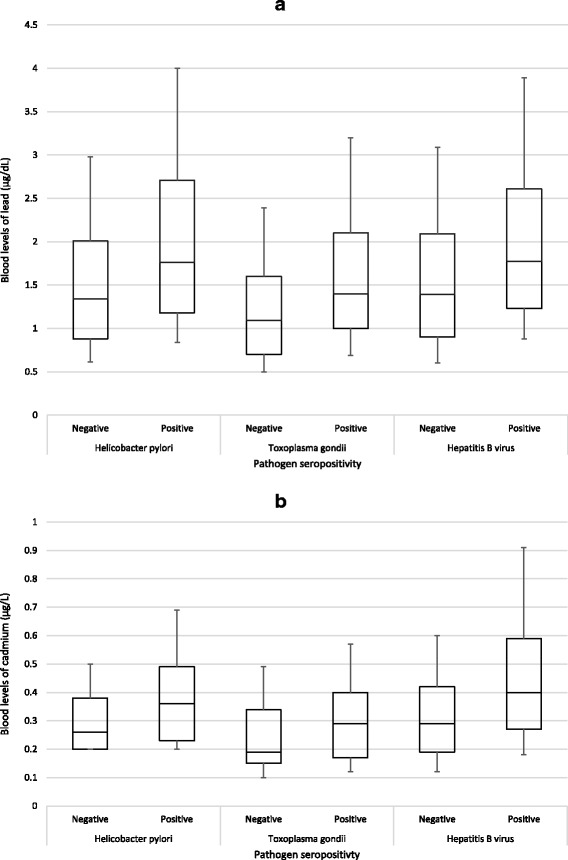
Box plots of 10th, 25th, 50th, 75th, and 90th percentiles for blood levels of lead (panel a) and cadmium (panel b) by pathogen seropositivity among non-smoking NHANES participants, 1999–2012

Box plots of 10th, 25th, 50th, 75th, and 90th percentiles for blood levels of lead (panel a) and cadmium (panel b) by pathogen seropositivity among non-smoking NHANES participants, 1999–2012