Fig. 4.

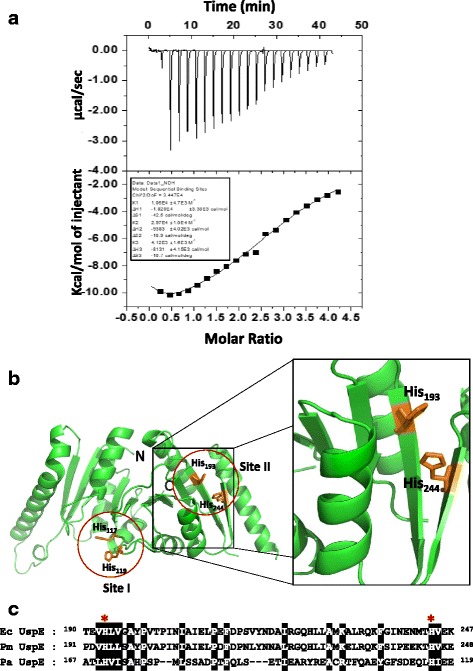
Representative isotherm for the binding of Cd2+ to UspE. a In each panel, top: raw data output of power (heat released) for each of 25 consecutive injections of CdCl2 (2 mM) or mitomycin C (2 mM) in to the protein (0.2 μM). Bottom: heat exchange at each injection obtained by integration of each injection, normalized to kcal/mol of CdCl2. The computer generated titration curve is best fit to a model of sequential binding with three sites (solid line). b The Cd2+ binding site I and site II are shown in the red circle. Close-up view of the Cd2+ binding site II, His193 and His 244 is shown as sticks colored orange. c Sequence alignment of the Cd2+ binding site II part of UspE proteins. The key conserved regions are highlighted in black. In key conserved regions, His 193 and His 244 are denoted with asterisks
