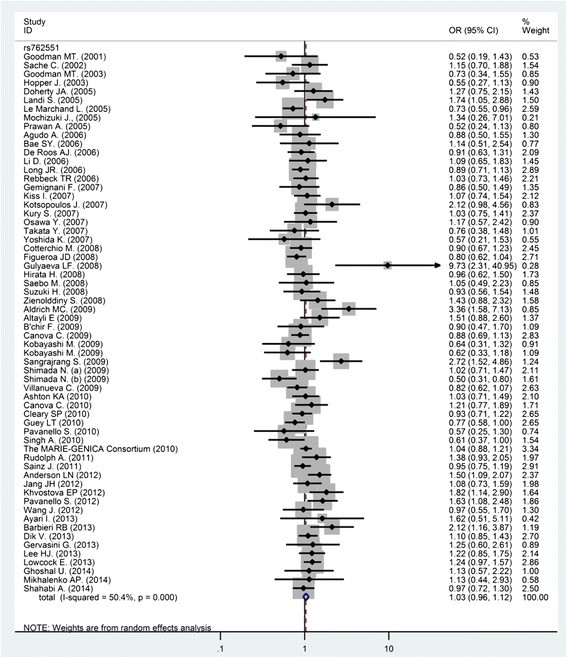
Fig. 2.

Forest plot of the CYP1A2 rs762551 and cancer meta-analysis under recessive models of inheritance. The diamonds and horizontal lines correspond to the study-specific odds ratio (OR) and 95 % confidence interval (CI)

Forest plot of the CYP1A2 rs762551 and cancer meta-analysis under recessive models of inheritance. The diamonds and horizontal lines correspond to the study-specific odds ratio (OR) and 95 % confidence interval (CI)