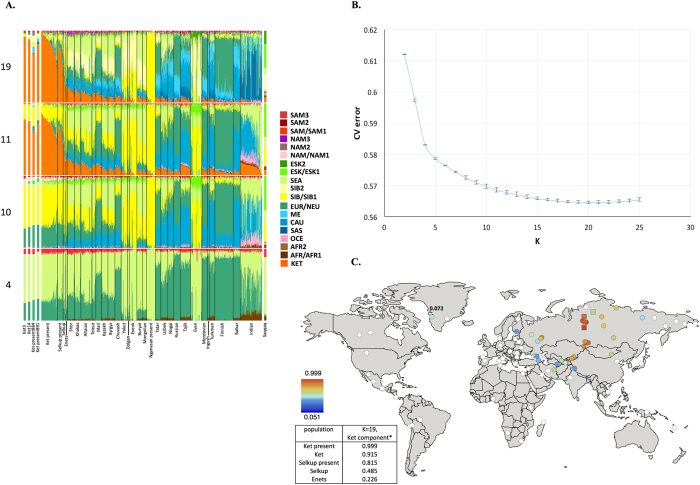
Figure 1.
(A) Admixture coefficients plotted for dataset ‘GenoChip + Illumina arrays’. Abbreviated names of admixture components are shown on the left as follows: SAM, South American; NAM, North American; ESK, Eskimo (Beringian); SEA, South-East Asian; SIB, Siberian; NEU, North European; ME, Middle Eastern; CAU, Caucasian; SAS, South Asian; OCE, Oceanian; AFR, African. The Ket-Uralic (‘Ket’) admixture component appears at K ≥ 11, and admixture coefficients are plotted for K = 4, 10, 11, and 19. Although K = 20 demonstrates the lowest average cross-validation error, the Ket-Uralic component splits in two at this K value, therefore K = 19 was chosen for the final analysis. Only populations containing at least one individual with >5% of the Ket-Uralic component at K = 19 are plotted, and individuals are sorted according to values of the Ket-Uralic component. Admixture coefficients for the Saqqaq ancient genome are shown separately on the right, and for two reference Kets and two Ket individuals from this study - on the left. (B) Average cross-validation (CV) error graph with standard deviations plotted. Ten-fold cross-validation was performed. The graph has a minimum at K = 20. (C) Color-coded values of the Ket-Uralic admixture component at K = 19 plotted on the world map using QGIS v.2.8. Maximum values in each population are taken, and only values >5% are plotted. Top five values of the component are shown in the bottom left corner, and the value for Saqqaq is shown on the map.

