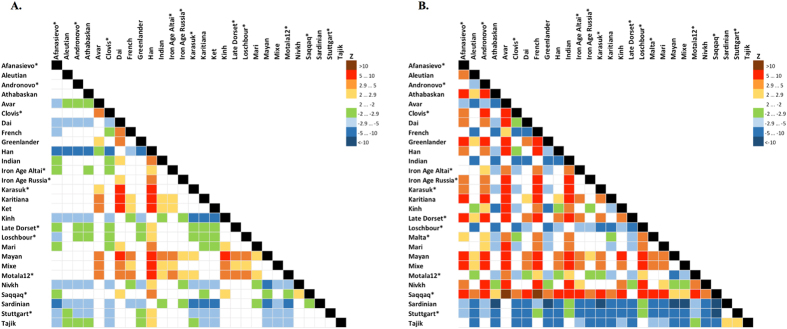
Figure 5.
Statistics f4 (Mal'ta, Yoruba; Y, X) (A), f4 (Ket, Yoruba; Y, X) (B) computed on the genome-based dataset with African, Australian and Papuan populations excluded. See the corresponding results for the dataset without transitions in Suppl. Figs 8.15 and 8.16, respectively. A matrix of color-coded Z-scores is shown, and ancient genomes are marked with asterisks. Z-score equals the number of standard errors by which the statistic differs from zero, and |Z| > 2.9 demonstrates that the statistic is significantly different from zero using Bonferroni correction for 27 independent tests (threshold p-value of 0.001852). Rows show Z-scores for f4 (Mal'ta, Yoruba; row, column) or f4 (Ket, Yoruba; row, column), vice versa for columns.

