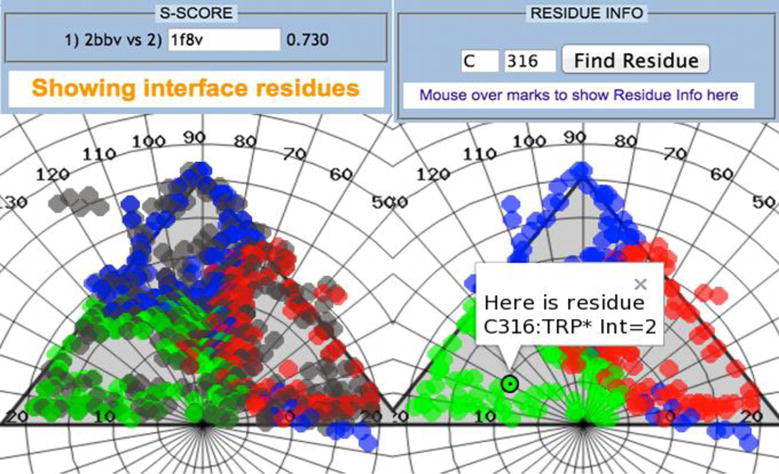
Figure 7.

Black Beetle Virus interface residues, color coded according to the local subunit environment. (Left) The application has the ability to calculate the S-score between two capsids. Once a second virus is selected by its PDBID, the metrics value is displayed in the control panel. Additionally, residues of the second virus are also displayed on the map (gray color), allowing for the visual assessment of where main quaternary differences might be. (Right) Another added feature is the ability to search for a specific residue by specifying a subunit and a sequence id.
