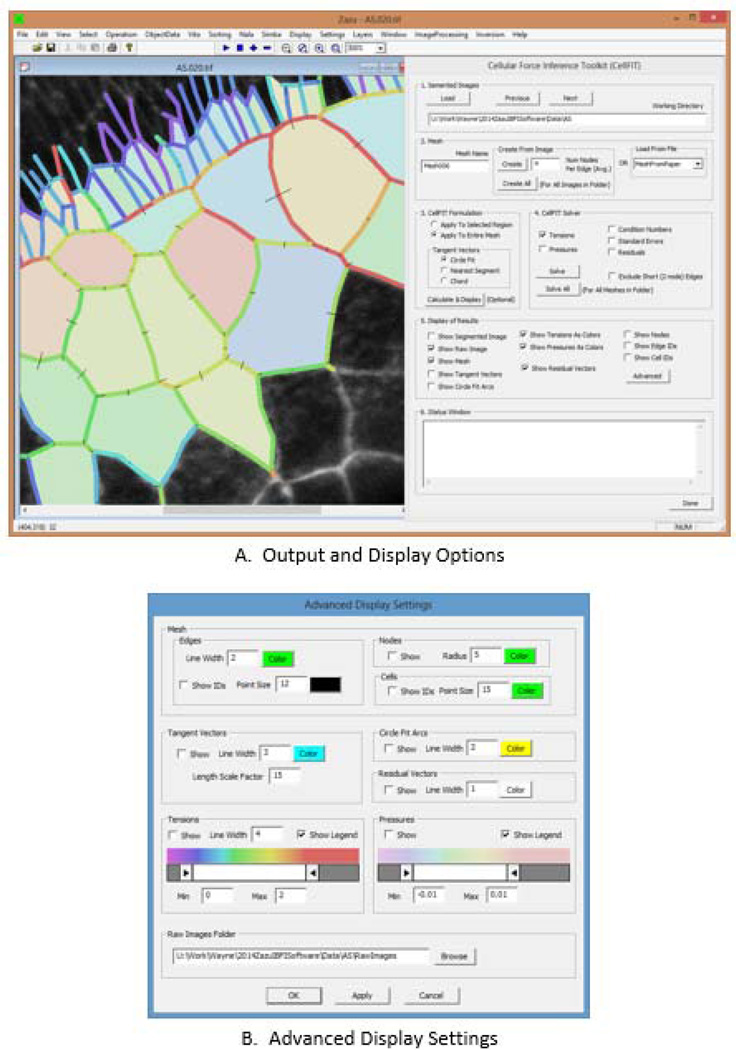
Fig. 7.
The CellFIT User Interface. The left side of part A shows a typical display window while the right side shows the primary user interface. This interface is designed to allow the user to control the various calculation steps in CellFIT and to make run-time choices. In contrast, the advanced interface shown in B is designed to facilitate data display and analysis. See text for details.

