Figure 3.

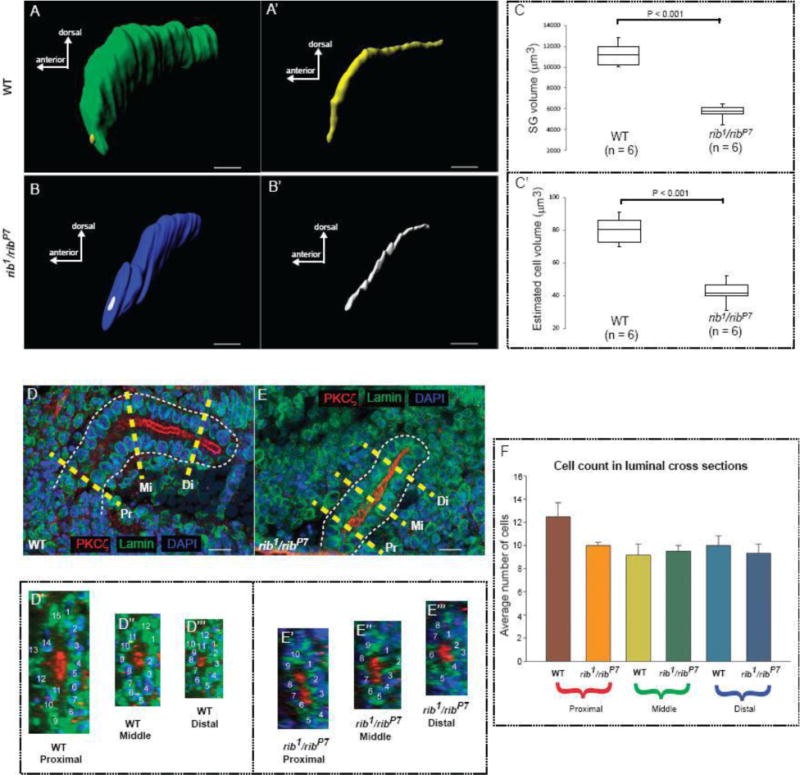
Loss of rib affects cell volume but not cell arrangement. (A) Whole surface rendering of a WT stage 12 SG. (A′) Luminal surface rendering of the gland shown in A. (B) Whole surface rendering of a rib1/ribP7 stage 12 SG. (B′) Luminal surface rendering of the gland shown in B. (C) The SG volume (difference between the whole volume and luminal volume) of the rib1/ribP7 mutants was significantly decreased (t-test, P < 0.001) compared to the WT. (C′) The estimated mean cell volume (SG volume/total cell count) of the rib1/ribP7 mutants was significantly decreased (t-test, P < 0.001) compared to the cell volume in the WT SG. (D) Representative scheme for obtaining cross-sections of the WT SG from three different regions along the length of the organ. Yellow dashed lines show Pr: proximal, Mi: middle and Di: distal sections. (D′–D‴) Cross-sections of the WT tube shown in ‘(D)’ from the proximal, middle and distal regions with nuclear count labels. (E) Representative scheme for obtaining cross-sections of the rib1/ribP7 SG from three different regions along the length of the organ. (E′ – E‴) Cross-sections of the rib1/ribP7 tube shown in ‘(E)’ from the proximal, middle and distal regions with nuclear count labels. (F) The number of cells (mean + SE) encircling the lumen was not significantly different (one-way ANOVA) between the WT and the rib1/ribP7. Scale bars: 10 μm.
