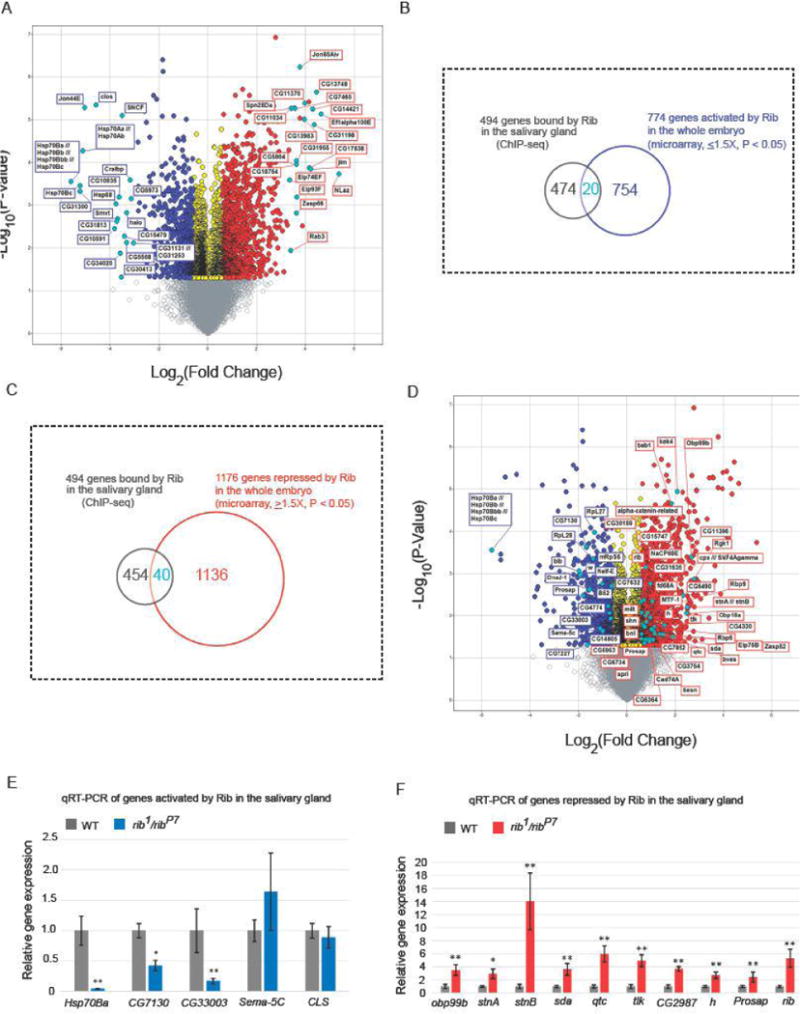
Figure 5.

Microarray gene expression analysis indicates the direction of transcriptional control of Rib targets. (A) RNA was isolated from three individual samples each of stage 11–16 WT and rib1/ribP7 embryos. Volcano plot shows genes that were downregulated (blue) or upregulated (red) at least 1.5-fold (P < 0.05) in rib mutants compared to WT. In each direction, the top 20 annotated candidates, based on fold change, are marked (cyan). Transcripts with fold change values between −1.5 and 1.5 (P < 0.05) are shown in yellow. Fold change values that are not statistically significant (P > 0.05) are indicated by gray. (B, C) Venn diagrams representing the overlap of 494 genes from the ChIP-seq and microarray (774 targets activated and 1176 repressed by Rib, respectively) data sets are shown. (D) The set of transcripts that are downregulated (blue) or upregulated (red) at least 1.5-fold (P < 0.05, microarray analysis) in rib mutants compared to WT and testing positive for SG Rib binding (ChIP-seq analyses) are marked (cyan). (E,F) qRT-PCR results for a subset of genes obtained from the overlap of ChIP-seq and microarray data confirms significant expression change in the same direction as observed with microarray analysis for all but two examples, Sema-5C and CLS. *P < 0.01, **P < 0.001, Mann-Whitney U test.
