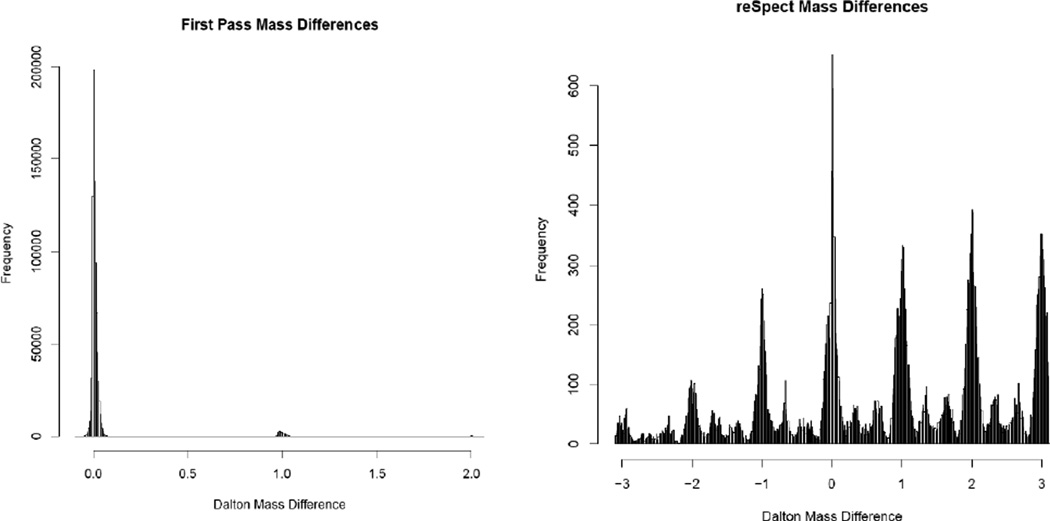
Figure 2. Histograms of mass differences between measured precursor m/z values and theoretical m/z values for the PSM assignments.
Representative histograms of mass differences between measured precursor m/z values and theoretical m/z values for the PSM assignments by the first pass search on the left, and PSM assignments after reSpect and re-search of a 48 fraction HeLa cell lysate dataset on right. In the left panel, the strong feature at 0 corresponds to the narrow m/z tolerance of the search, while the features at +1 and +2 Daltons are due to misassigned primary isotopes.

