Figure 1.
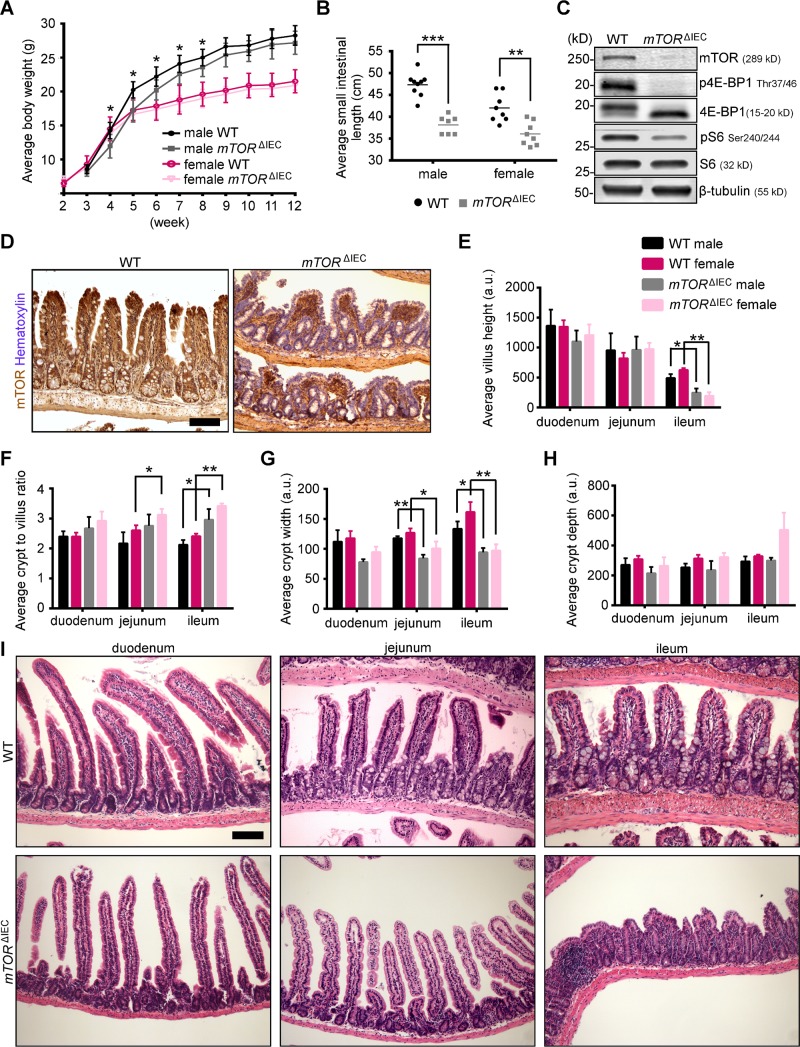
mTOR IEC-specific disruption results in a shortened small intestine and altered distal epithelial morphology. A) Male and female mTORΔIEC and littermate control growth curves (n ≥ 5 mice). B) Average small intestinal length of male and female mTORΔIEC and littermate controls. Lines indicate the mean. C) Representative mTOR signaling pathway Western blot of mTORΔIEC and littermate control small intestinal crypts (n = 4 mice). D) mTOR IHC (brown) shows IEC-specific absence in mTORΔIEC mice. Hematoxylin indicates DNA (blue). It is representative of mice 2–10 mo of age (n > 10 mice). Quantification of regional villus height (E), crypt:villus ratio (F), crypt width (G), and average crypt depth (H) for male and female mTORΔIEC and WT littermates (n ≥ 3 mice). I) Representative H&E of mTORΔIEC and WT littermate duodenum, jejunum, and ileum. Error bars represent sd. *P < 0.05; **P < 0.01; ***P < 0.001. Scale bars, 100 μm.

