Figure 2.
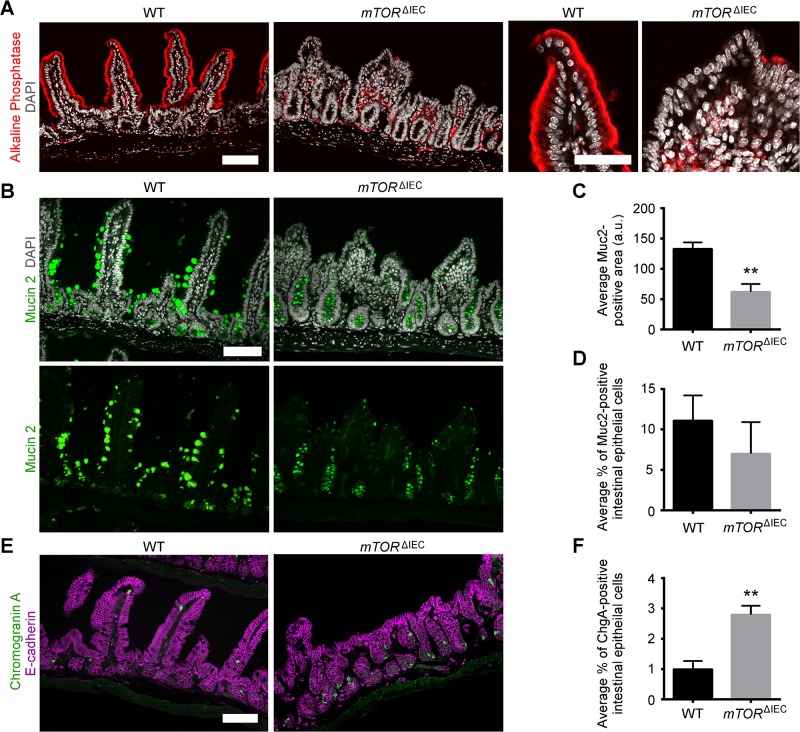
mTOR promotes enterocyte maturation, regulates goblet cell size, and suppresses EEC number. A) Representative alkaline phosphatase (red) immunofluorescence (IF), enterocyte marker, for mTORΔIEC and WT ileal epithelium. DAPI indicates DNA (gray). Right panels show a representative WT and mTORΔIEC villus. Scale bars, 100 μm (left panels) and 50 μm (right panels). B) Representative MUC2 (green) IF, goblet cell marker, for mTORΔIEC and WT ileal epithelium. DAPI indicates DNA (gray). Scale bar, 100 μm. C) Average MUC2 area of WT vs. mTORΔIEC ileal goblet cells. D) Average percentage of MUC2+ IECs in WT vs. mTORΔIEC ileal epithelium. E) Representative ChgA (green) IF, EEC marker, for mTORΔIEC and WT ileal epithelium. E-cadherin is shown in magenta. Scale bar, 100 μm. F) Average percentage of ChgA+ IECs in WT vs. mTORΔIEC ileal epithelium. A–F) n = 3 mice per genotype. Error bars represent sd. **P < 0.01.

