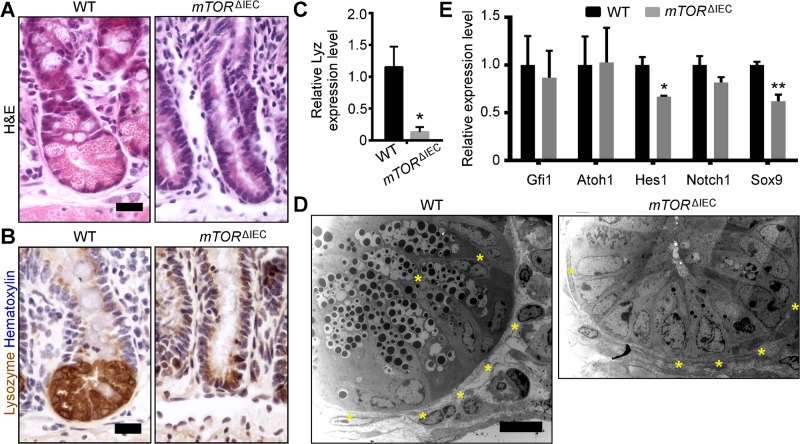
Figure 3.
mTOR disruption impairs Paneth cells. A) H&E staining of WT and mTORΔIEC ileal crypts (n > 20 mice). B) LYZ IHC (brown), mature Paneth cell marker (n > 10 mice). C) Relative expression levels of Lyz transcript in WT and mTORΔIEC ileal crypts. D) Representative TEM images of a WT and mTORΔIEC ileal crypt base. Asterisks indicate Paneth cells (n = 2 mice). E) Relative expression levels of Paneth cell specification and differentiation genes in WT and mTORΔIEC distal small intestinal crypts. C, E) n = 3 mice. Error bars represent sem.*P < 0.05; **P < 0.01. Scale bars, 20 μm (A, B) and 10 μm (D).

