
Figure 5.
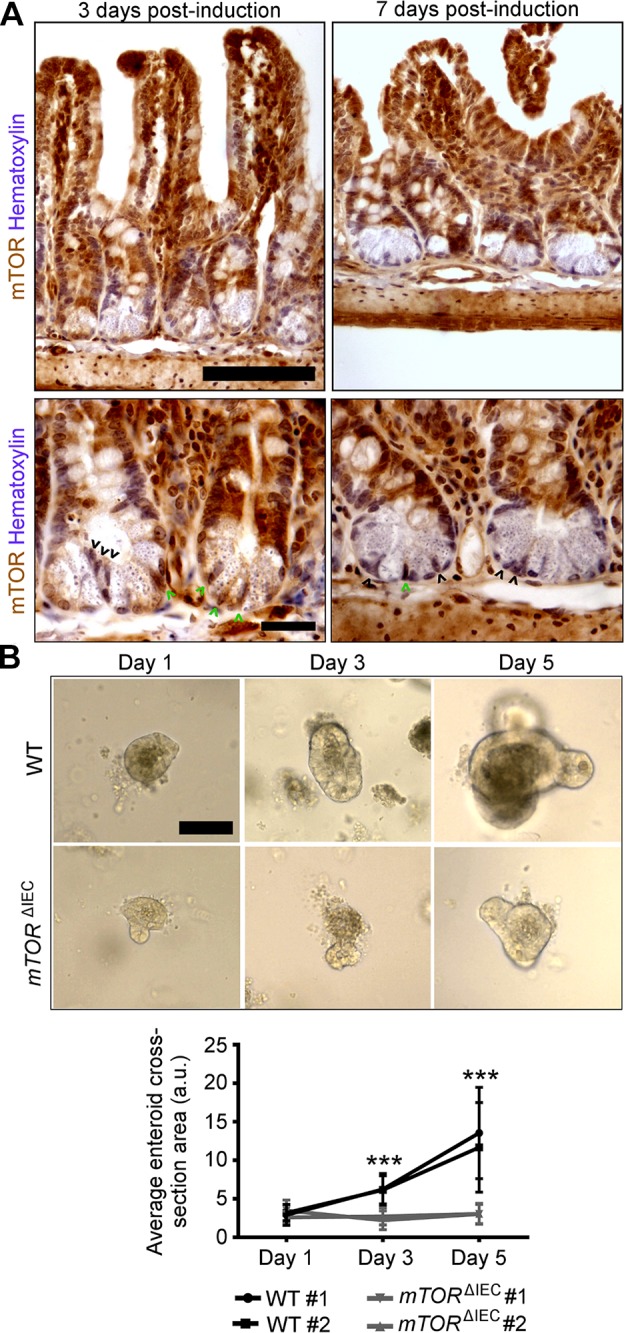
mTOR is necessary for ISC function. A) Upper panels show mosaic mTOR disruption in mTORflox/flox Villin-creERT2 crypts at 3 and 7 d postinduction. Villus-localized IECs are largely mTOR WT (brown). Hematoxylin indicates DNA (blue). In the lower panels, higher magnification of representative mTORflox/flox Villin-creERT2 crypts at 3 and 7 d postinduction shows mosaic Paneth cell and CBC mTOR loss. Black arrowheads point to mTOR mutant CBCs. Green arrowheads point to WT CBCs. Scale bars, 100 μm (upper panels) and 20 μm (lower panels). B) Representative images of WT and mTORΔIEC ileal enteroids at 1, 3, and 5 d postculture (n = 5 mice; 2–10 mo of age). Scale bar, 100 μm. Quantification is shown of average enteroid cross-sectional area on d 1, 3, and 5 postculture (n = 2 mice). Each line indicates a single mouse with ≥10 enteroids measured per mouse per day of culture. Error bars represent sd, indicating variability in enteroid size within each mouse. ***P < 0.001.