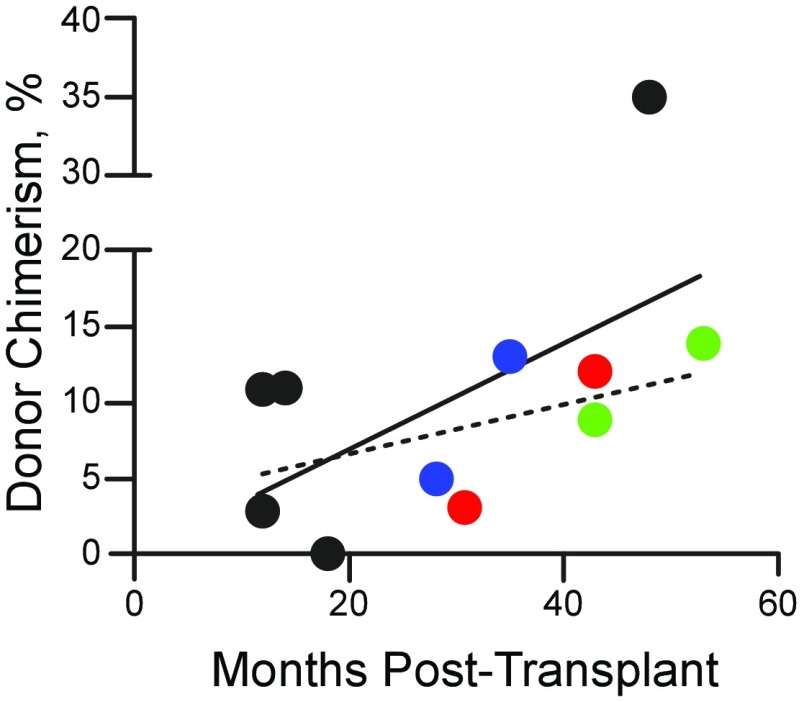
Figure 4.
Donor-derived adipocytes accumulate over time in humans. Donor adipocyte chimerism values from Table 2 are plotted vs. months after transplant. Colored data points (blue, red, and green) represent values from participants for whom initial and secondary biopsies were obtained. Linear regression for all data points (solid black line, R2 = 0.3074) is shown. Linear regression for all points except the 35% value at 48 mo (hashed black line, R2 = 0.2332) is shown.

