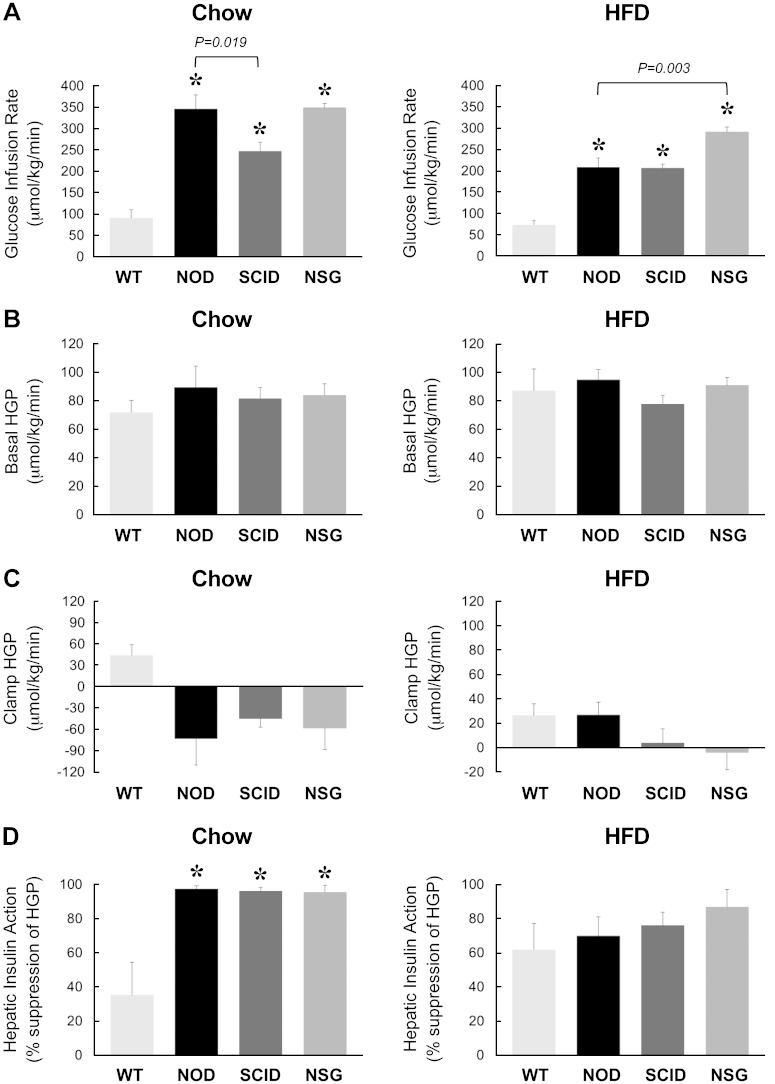
Figure 2.
A 2 h hyperinsulinemic-euglycemic clamp was performed in 20-wk-old WT, NOD, SCID, and NSG mice fed a standard chow diet (n = 5–11 mice per group, left) or after 6 wk of an HFD (n = 6–15 mice per group, right). A) Steady-state glucose infusion rates during clamps. B, C) HGP at basal state and (B) during insulin-stimulated state (clamp) (C). D) Hepatic insulin action expressed as insulin-mediated percent suppression of basal HGP. *P < 0.05 vs. WT mice fed a respective diet.

