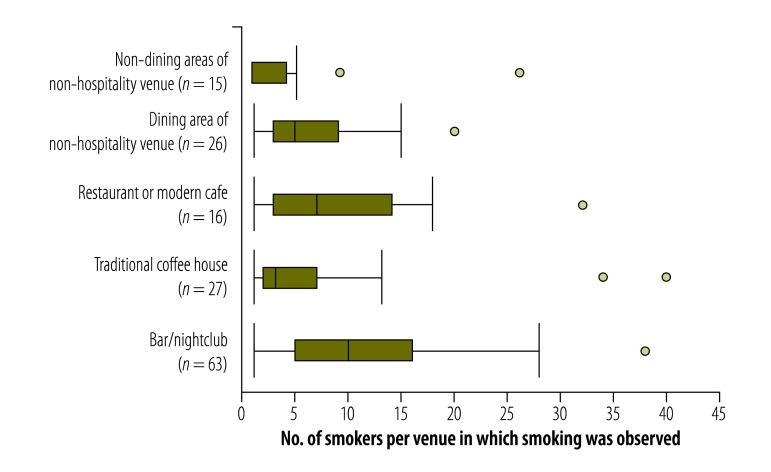
Fig. 3.
Numbers of smokers observed within venues where any smoking was observed, Turkey, 2012–2013
Notes: In each of the box-and-whisker plots, the line within the box indicates the median, the box indicates the interquartile range, the error bars indicate one and a half times the length of the box from either end of the box, and the circles indicate outlying data points.

