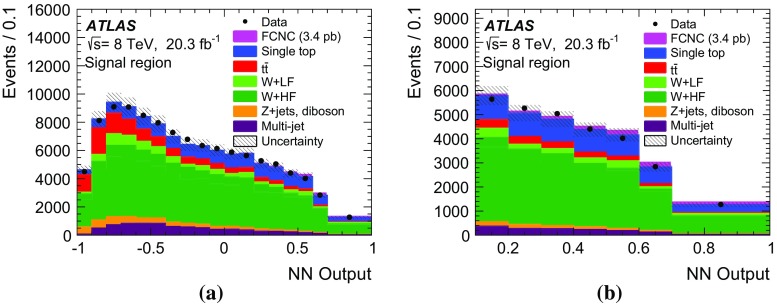
Fig. 9.
a Neural-network output distribution in the signal region and b in the signal region with neural network output above 0.1. In both figures the signal contribution scaled to the observed upper limit is shown. The hatched band indicates the total posterior uncertainty as obtained from the limit calculation

