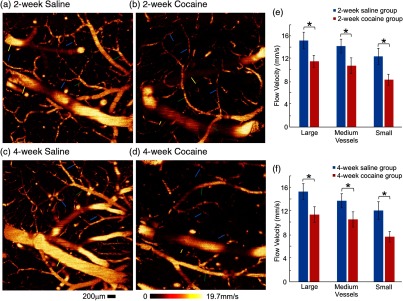
Fig. 2.
Chronic cocaine decreased CBFv across the cerebrovascular tree. Quantitative CBFv (ODT) images in the somatosensory cortex of the (a, c) saline-treated control groups versus (b, d) those of the chronic cocaine-treated groups for 2 and 4 weeks. Image sizes are , . Yellow, green, and blue arrows are used to demonstrate the large (; ), medium (; ), and small vessels (; ), respectively. (e, f) Statistical comparisons of CBFv among various groups, indicating the significant decreases of CBFv across the whole vascular trees. * significant differences between saline- and cocaine-treated groups (, ; ).

