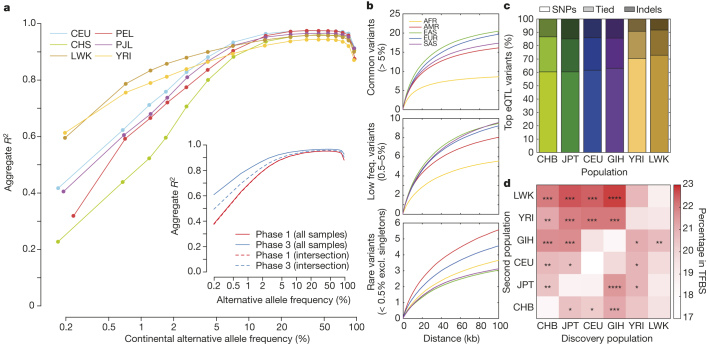
Figure 4. Imputation and eQTL discovery.
a, Imputation accuracy as a function of allele frequency for six populations. The insert compares imputation accuracy between phase 3 and phase 1, using all samples (solid lines) and intersecting samples (dashed lines). b, The average number of tagging variants (r2 > 0.8) as a function of physical distance for common (top), low frequency (middle), and rare (bottom) variants. c, The proportion of top eQTL variants that are SNPs and indels, as discovered in 69 samples from each population. d, The percentage of eQTLs in TFBS, having performed discovery in the first population, and fine mapped by including an additional 69 samples from a second population (*P < 0.01, **P < 0.001, ***P < 0.0001, McNemar’s test). The diagonal represents the percentage of eQTLs in TFBS using the original discovery sample.

