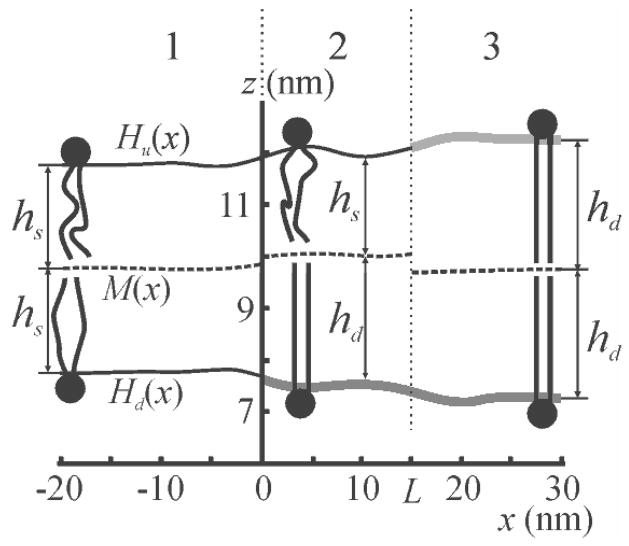
FIG. 2.
Side view of membrane shape calculated for a distance L = 15 nm between the domain boundaries and a lateral tension in both monolayers σ = 5 mN/m. Membrane zones are denoted at the top. The thick grey lines correspond to surfaces of domain monolayers; the thin solid black lines correspond to surfaces of the surrounding membrane monolayers.

