
Figure 4.
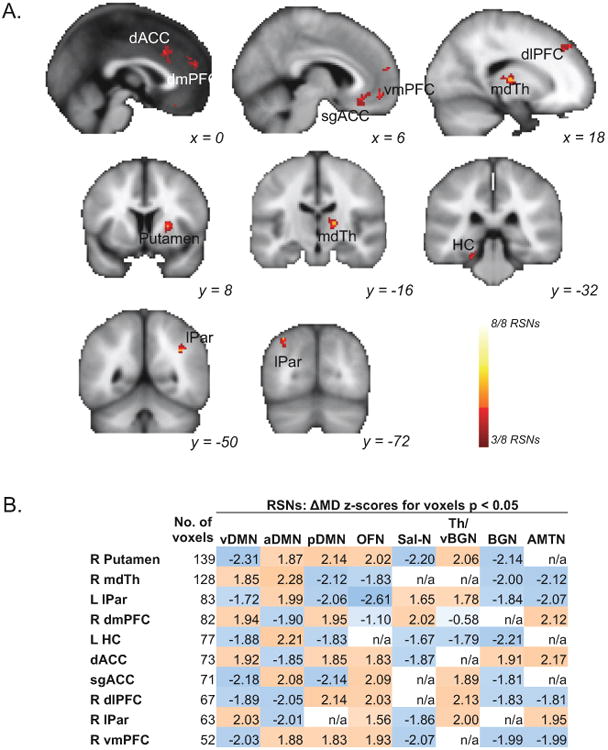
Changes in depressive symptoms (ΔMD) in patients receiving right-unilateral electroconvulsive therapy (ECT) correspond with changes in resting-state functional connectivity (RSFC) in regions overlapping across resting-state networks (RSNs). A. Statistical maps display voxels exhibiting significant partial conjunction (pcorr < 0.0001) of voxelwise ΔMD effects (p < 0.05) in at least 3 different resting-state networks (RSNs; k > 50). Color indicates the number of RSNs significant for each voxel (key at lower right). Significant effects are shown for dorsal and subgenual anterior cingulate (dACC and sgACC respectively), dorsomedial, ventromedial, and dorslateral prefrontal cortex (dmPFC, vmPFC, and dlPFC respectively), mediodorsal thalamus (mdTh), hippocampus (HC), and lateral parietal cortex (lPar). B. A matrix shows the mean ΔMD z-score, representing the relationship between changes in RSFC and changes in depressive symptoms (HAMD score) in regions of interest (ROIs) displayed in A. Values are listed for each RSN (columns; abbreviations given in Figure 1B) and significant region (rows). Color indicates the direction of the effect; positive values in orange reflect instances where larger changes in ROI-to-RSN RSFC correlate with larger improvements in HAMD scores, while negative values in blue reflect larger changes in ROI-to-RSN RSFC correlating with minimal improvements in HAMD. ROIs with no significant voxels in a given RSN are indicated with “n/a.”