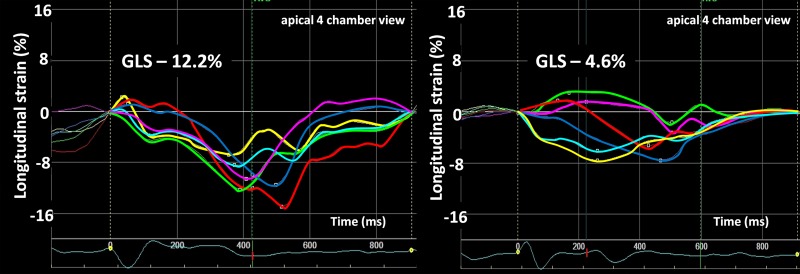
Figure 1.
Longitudinal strain curves from apical four-chamber view displaying 6 of the 18 LV segments used to calculate GLS before CRT. Left panel: patient with moderately impaired longitudinal function (GLS, −12.2%) before CRT and alive at 2 years. Right panel: patient with severely impaired longitudinal function (GLS, −4.6%) before CRT and dead at 2 years.

