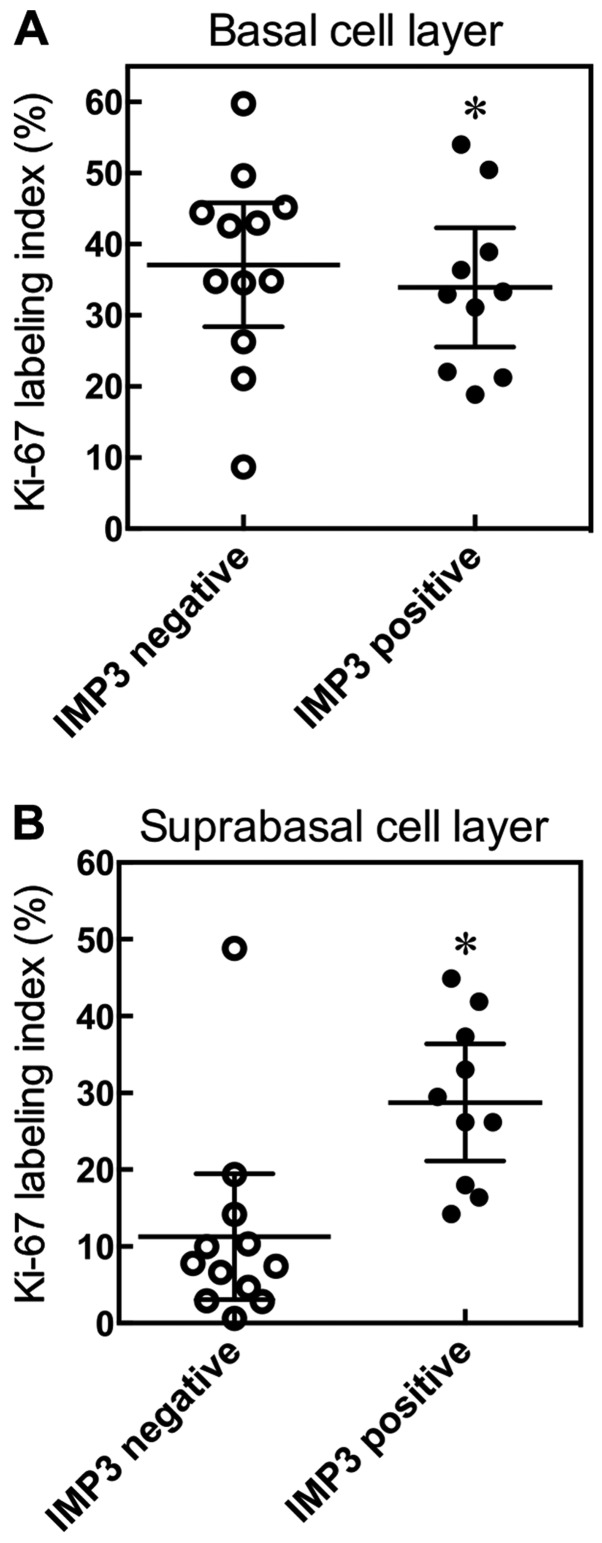
Figure 7.
Relationship between Ki-67 and IMP3. SCC cases were divided into two groups, an IMP3 positive group and an IMP3 negative group, and the relationship between ki-67 and IMP3 in basal and suprabasal layers examined. Results are expressed as means ±95% confidence interval. *P=0.4483 compared with IMP3 negative group, Mann-Whitney U-test (A). *P=0.0022 compared with IMP3 negative group, Mann-Whitney U-test (B).

