Figure 2.
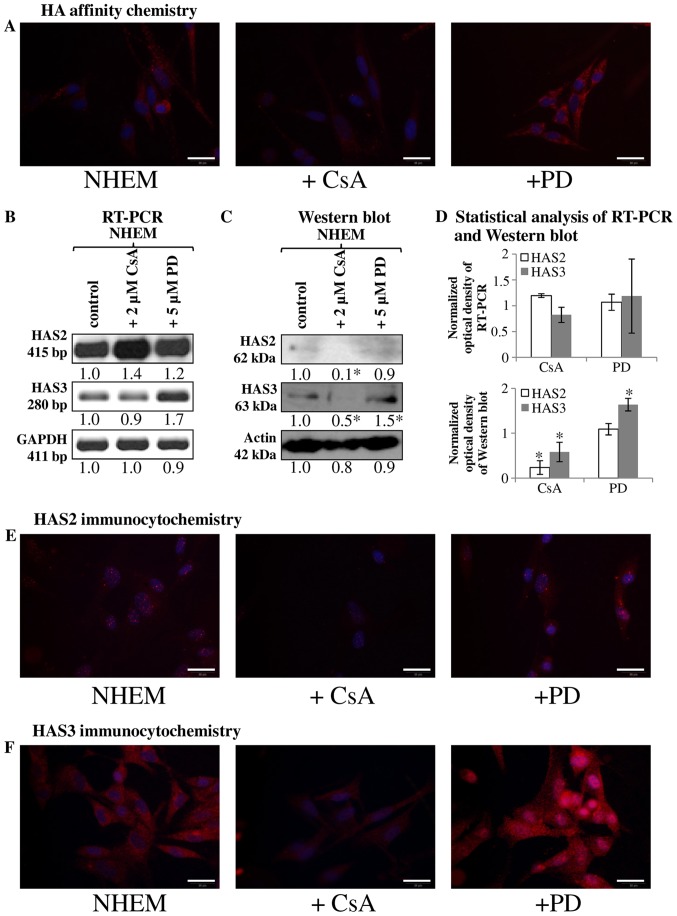
Detection of HA, HAS2 and HAS3 in NHEM cells in vitro. Untreated cells of NHEM, +CsA (continuous application of CsA in 2 μM) and +PD (continuous application of PD098059 in 5 μM) experimental groups were performed. (A) HA affinity cytochemistry demonstrating secreted HA in red (Streptavidin-Alexa 555). Scale bar, 20 μm. Representative photomicrographs of 3 independent experiments. (B) mRNA expression of HAS2 and HAS3 in NHEM cells. GAPDH was used as an inner control. Representative results from three independent experiments. (C) Protein expression level of HAS2 and HAS3 in NHEM cells. Actin was used as an internal control. Representative results from three independent experiments. Optical density of signals was measured and results were normalised to the optical density of controls. In (B and C) numbers below the signals represent integrated densities of signals determined by ImageJ software. (D) Statistical analysis of RT-PCR and western blot results. All data are the average of at least three different experiments. Statistical analysis was performed by Student's t-test. The data were normalized on GAPDH or actin and are expressed as mean ± SEM. (E and F) Immunocytochemistry of HAS2 and HAS3 appearing in red (Alexa 555). DAPI was used for visualisation of nuclei. Scale bar, 20 μm. Representative photomicrographs of three independent experiments.

