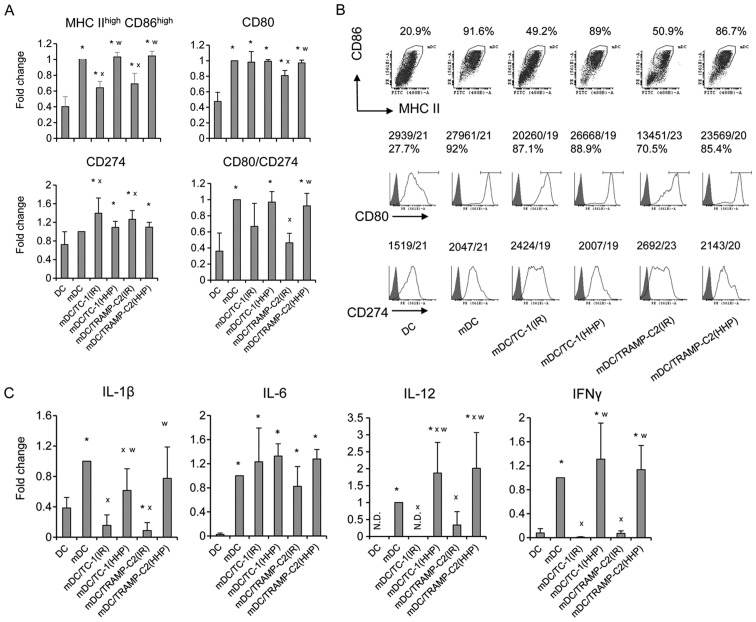
Figure 4.
Phenotype of mouse DC after the interaction with HHP- or IR-treated TC-1 or TRAMP-C2 tumor cells. DC were prepared from bone marrow precursors and pulsed with HHP- or IR-treated tumor cells by 48-h incubation in the ratio of 2:1. DC pulsed with the tumor cells were then treated for 24 h with CpG 1826 and analyzed by flow cytometry. (A and B) Expression of MHC class II and costimulatory molecules (as a fold change of MFI or as a dot plot/histograms with MFI). (C) Production of cytokines by DC culture (as a fold change relative to mature DC designated as mDC). mDC produced IL-1β in the range of 233–749 pg/ml, IFNγ in the range of 299–749 pg/ml, IL-6 in the range of 18.2–49.2 ng/ml, and IL-12 in the range of 760–2235 pg/ml. Representative results from at least four independent experiments. *P<0.05 vs. DC, xP<0.05 vs. mDC, wP<0.05 vs. DC pulsed with IR-treated tumor cells, Student's t-test.

