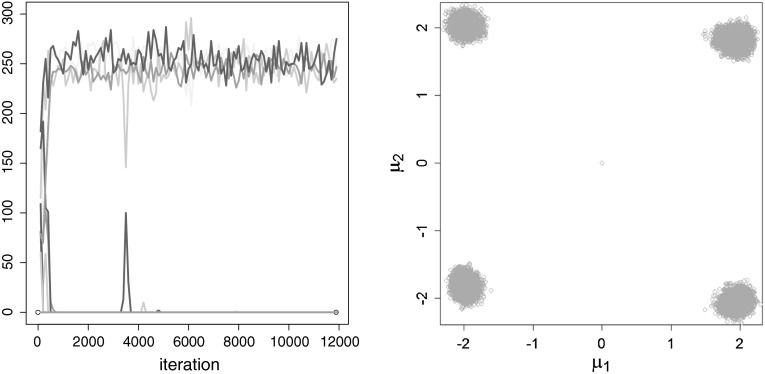
Fig. 6.
Simulation setup with equal weights: MCMC run of a single data set, , standard prior. Trace plot of the number of observations allocated to the different components, burn-in included (left-hand side) and point process representation of the posterior component mean draws where and which were non-empty, is plotted against (right-hand side)

