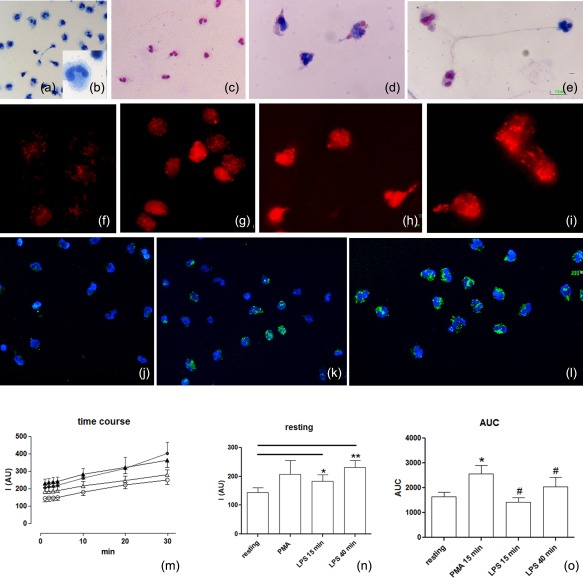
Figure 3.

Evaluation of intracellular reactive oxygen species (ROS). (a–e) Light microscopy: resting (a,b) and stimulated cells (c–e) are stained using the May–Grünwald–Giemsa technique. The differential staining of neutrophils depends on cytoplasmic pH (the pink mark indicates acid pH while the blue mark shows an alkaline pH). (f–o) ROS evaluation was obtained using fluorescence dyes: the MitoSOX red used as a selective indicator of mitochondrial superoxide and 2′,7′‐dichlorodihydrofluorescein diacetate (H2DCFDA) to detect the overall degree of cytoplasmic ROS. Most ROS (red signal) were generated in mitochondria (f–i) starting from the resting condition (f) up to 15 min (g) and 40 min (h,i) after lipopolysaccharide (LPS) stimulation. The increase of the overall degree of intracellular ROS (j–l), using H2DCFDA, is localized by fluorescence microscopy: (j) cells in resting condition (k,l) 15 and 40 min after LPS stimulation, respectively. In neutrophils, from the resting condition to neutrophil extracellular trap (NET) formation, the concentration of cellular ROS levels increased following appropriate [LPS and phorbol myristate acetate (PMA)] stimulation on a rapid time‐scale. (m) Spectrofluorimetric evaluation of the time–course of ROS generation in human neutrophils under resting conditions (empty circle), prestimulation for 15 min with PMA (filled circles) for 15 min (empty triangles) or 40 min (filled triangles) with LPS. (n) Delta variations of values measured in neutrophils under the different conditions. (o) Area under the curve (AUC) of fluorescence measured for detection of neutrophil ROS generations during the 30 min of detection. Data are presented as mean ± standard error of at least three to five separate experiments. *P < 0·05 versus resting PMN; #P < 0·05 versus PMA.
