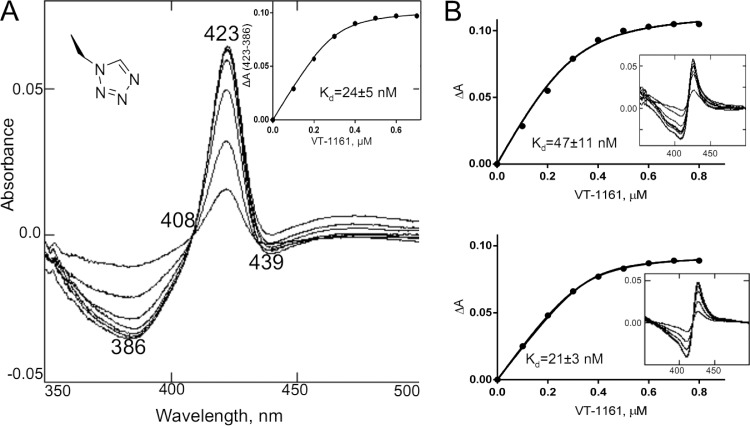
FIG 1.
(A) Spectral response of T. cruzi CYP51 to the addition of the heme-coordinating ligand 1-tetrazole VT-1161, shown as the difference in the type 2 binding spectra. The P450 concentration was 0.3 μM, and the optical path length was 5 cm. (Inset) The titration curve obtained using equation 1. ΔA(423-386), the difference in absorption between A423 and A386. (B) The corresponding titration curves and type 2 spectral responses (insets) of the A. fumigatus (top) and C. albicans (bottom) CYP51 orthologs.

