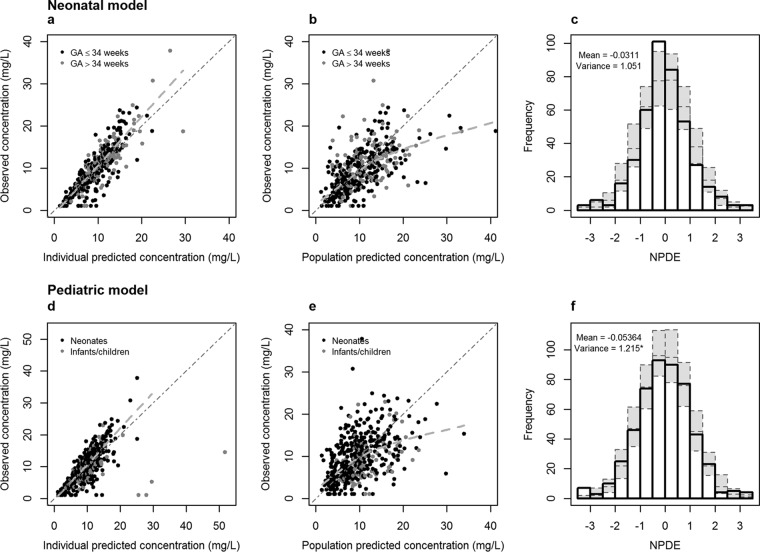
FIG 1.
Results of the external validation of the models: observed versus individual predicted concentrations (a and d) and observed versus population predicted concentrations (b and e) for the neonatal model (black dots, preterm neonates; gray dots, term neonates) and the pediatric model (black dots, postnatal age of <31 days; gray dots, postnatal age of >30 days). The dotted lines represent the regression lines. The histograms (c and f) show the distributions of the normalized prediction distribution errors (NPDE) for, respectively, the neonatal model and the pediatric model, with mean and variance of NPDE analysis. The gray dotted boxes reflect the variance of the NPDE. *, variance is significantly different from 1 (P < 0.01).

