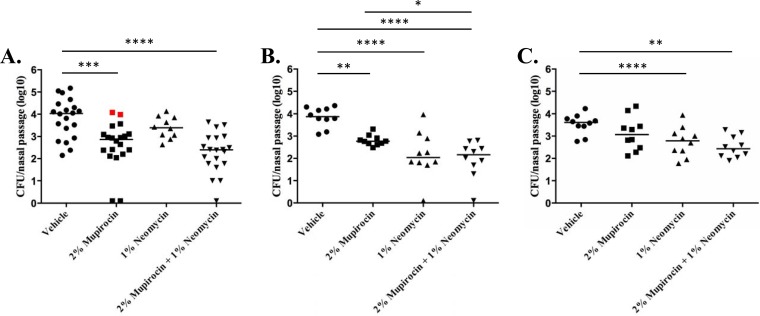
FIG 3.
Murine nasal decolonization measures. (A to C) The numbers of CFU per mouse nasal passage (y axis) after 3 days of dosing with PEG-based ointment containing the indicated antibiotic or antibiotic mixture (x axis) are plotted. Results for S. aureus strain UAMS-1 (A), USA300 (B), and BAA-1708 (C) are shown; red data points indicate low-level mupirocin-resistant isolates. Each symbol represents the value for an individual mouse. Each horizontal bar is the mean for the group of mice. Significant reductions in bacterial burden compared to the bacterial burden for mice treated with vehicle by one-way ANOVA are indicated by bars and asterisks as follows: *, P ≤ 0.05; **, P ≤ 0.01; ***, P ≤ 0.001; ****, P ≤ 0.0001.

