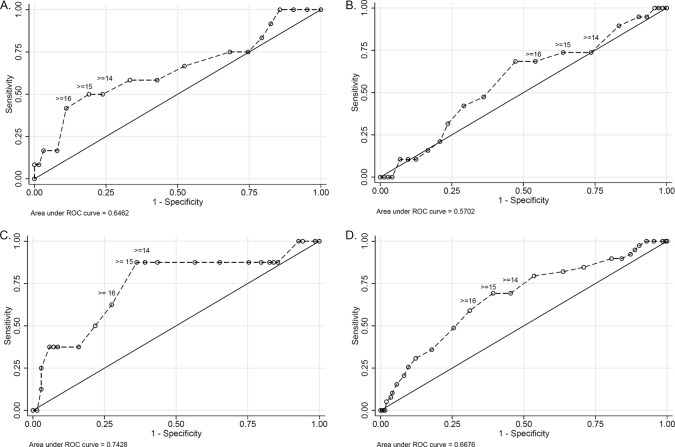
FIG 2.
Receiver operating characteristic (ROC) curves for the predictive capacity of m-APACHE-II score (on day 0 of infection) for in-hospital mortality. Dashed lines, predictive capacity of the respective morbidity indices for the mortality; solid line, line of no-discrimination. m-APACHE-II score values of 14, 15, and 16 are labeled for visual interpretation. (A) ROC curve for m-APACHE-II score on the day of infection among 75 patients in cohort 1. (B) ROC curve for m-APACHE-II score on the day of infection among 91 patients in cohort 2. (C) ROC curve for m-APACHE-II score on the day of infection among 77 patients in cohort 3. (D) ROC curve for m-APACHE-II score on the day of infection among 235 unique patients in the pooled cohort.

