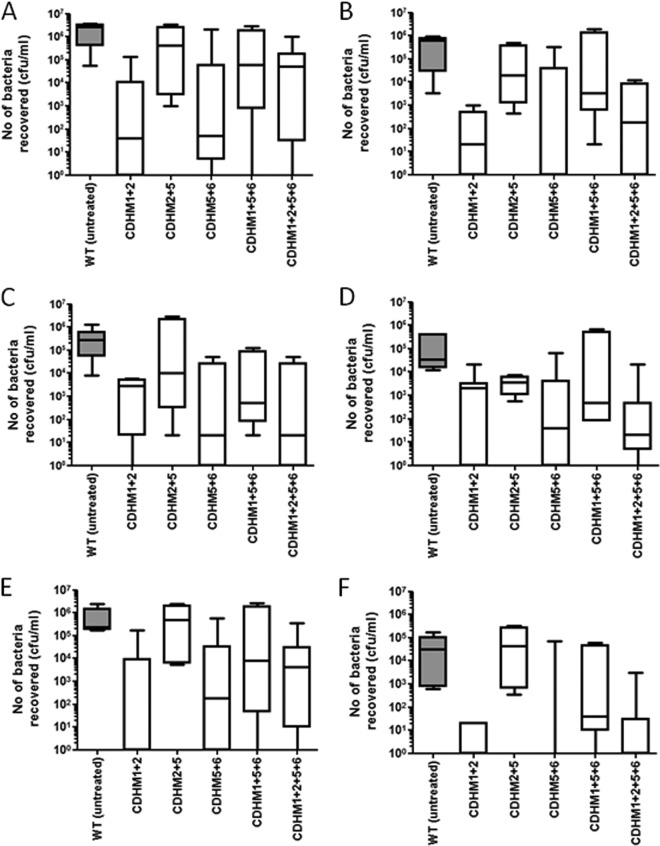
FIG 5.
Levels of colonization in animals treated with different phage combinations and culled at 36 h postchallenge with CD105HE1. Changes in vegetative cell populations (A to D) and changes in relative levels of recovered C. difficile spores (E and F) are shown. (A to D) The average total number of LA bacteria recovered from the cecal contents (A), LA bacteria recovered from the colon (B), TA bacteria recovered from the cecum (C), and bacteria associated with the colon (D) are presented. (E and F) The number of heat-resistant (spores) LA bacteria from the cecum (E) and the number of spores recovered from the lumen of the colon (F) are also shown. The median level of colonization is represented, while boxes indicate the upper and lower quartile spread of colonization within the group. The whisker bars represent the highest and lowest levels of colonization observed from data generated from a minimum number of four animals for each treatment. WT, wild type.

