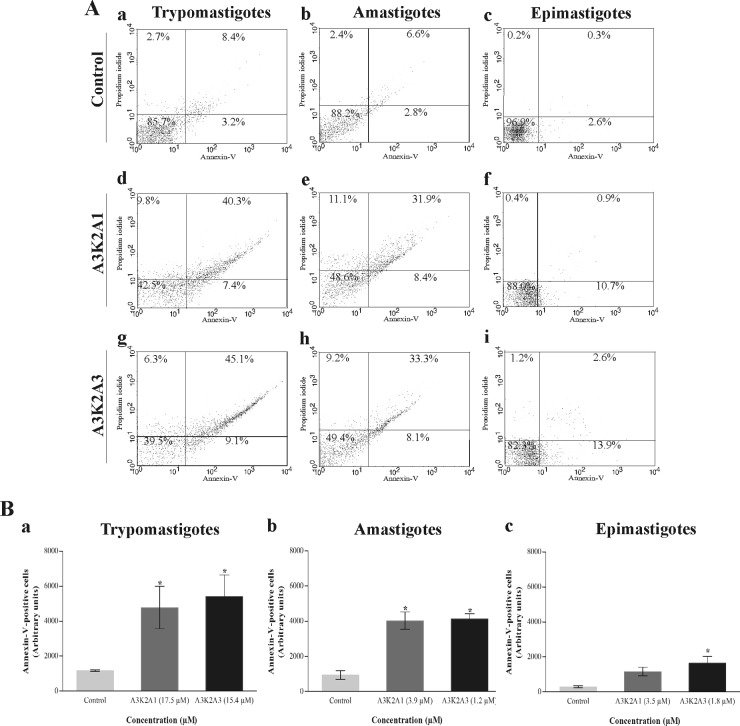
FIG 10.
Phosphatidylserine exposure in Trypanosoma cruzi treated with A3K2A1 or A3K2A3 for 24 h at concentrations corresponding to IC50s using annexin V/FITC and PI. (A) Typical histograms for trypomastigotes (a, d, and g), amastigotes (b, e, and h), and epimastigotes (c, f, and i). (a, b, and c) Untreated parasites; (d, e, and f) A3K2A1-treated parasites; (g, h, and i) A3K2A3-treated parasites. Percentages of annexin V-positive cells are shown in the upper and lower right quadrants. Percentages of annexin V-negative cells are shown in the upper and lower left quadrants. (B) Annexin V-positive cells in trypomastigotes (a), amastigotes (b), and epimastigotes (c). Asterisks indicate significant differences relative to the control group (P ≤ 0.05).

