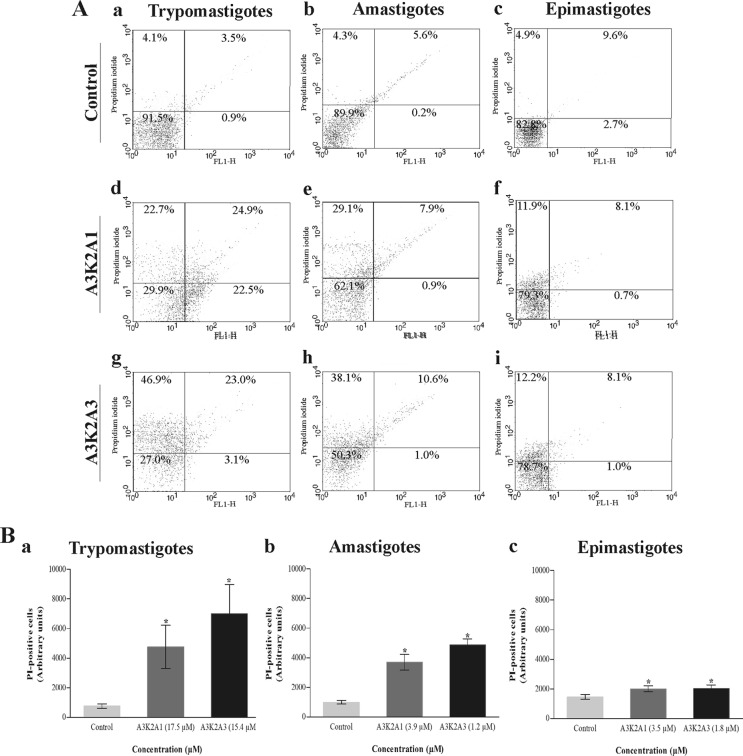
FIG 2.
Cell membrane integrity assay of Trypanosoma cruzi treated with A3K2A1 or A3K2A3 for 24 h at concentrations corresponding to IC50s using PI staining. (A) Typical histograms for trypomastigotes (a, d, and g), amastigotes (b, e, and h), and epimastigotes (c, f, and i). (a, b, and c) Untreated parasites; (d, e, and f) A3K2A1-treated parasites; (g, h, and i) A3K2A3-treated parasites. The percentages of PI-positive cells are shown in the upper right and left quadrants. The percentages of PI-negative cells are shown in the lower right and left quadrants. (B) PI-positive cells in trypomastigotes (a), amastigotes (b), and epimastigotes (c). Asterisks indicate significant differences relative to the control group (P ≤ 0.05).

