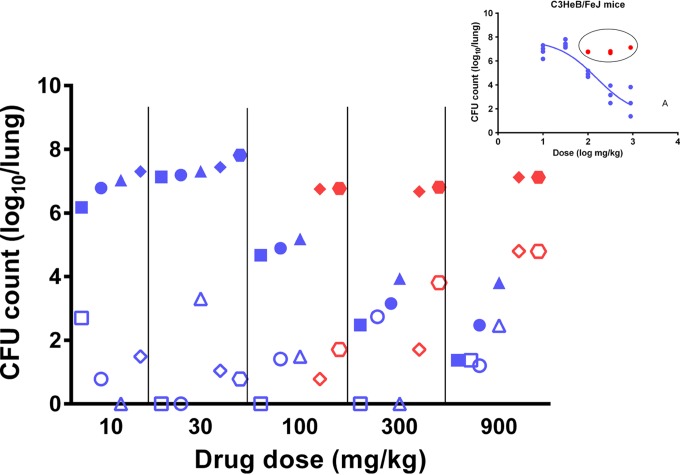
FIG 4.
Total CFU counts (solid symbols) and PZA-resistant CFU counts (open symbols) in C3HeB/FeJ mice treated with increasing PZA doses. Each symbol shape represents an individual mouse in its dose group. Blue, CFU counts from mice considered to fit the dose-response curve shown in the inset; red, CFU counts from mice considered nonresponsive to the dose increase; solid symbols, total CFU counts determined on drug-free medium for each individual mouse; open symbols, resistant-CFU counts determined on PZA-containing plates for the same mouse.

