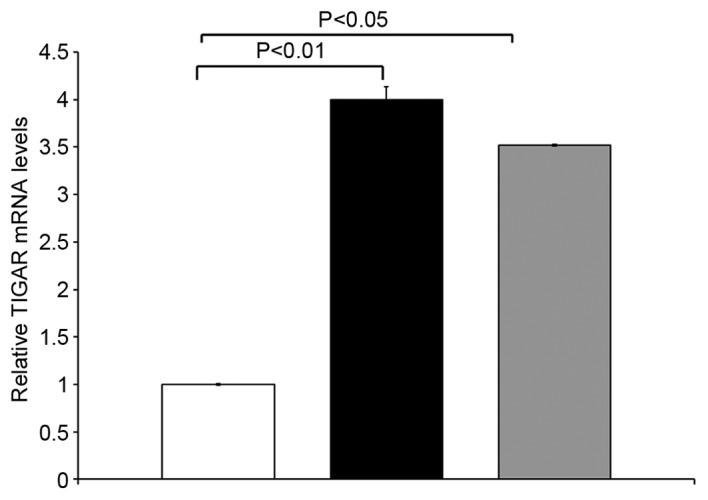
Figure 1.

TIGAR mRNA levels were determined by qRT-PCR. The results are expressed as relative TIGAR mRNA levels (mean ± SD of three determinations) compared with that obtained for GAPDH as a control. Adjacent normal (white bar); stage II (black bar); stage III (grey bar).
