
Fig. 3.
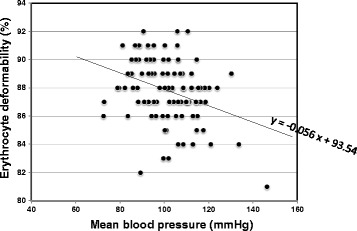
Individual erythrocyte deformability (%) is plotted as a function of the corresponding mean blood pressure (BP; mmHg) in the hypertensive patients (n = 101). Erythrocyte deformability is inversely proportional to the mean BP (r = −0.303, p = 0.002), showing a regression line of y = −0.056x + 93.54