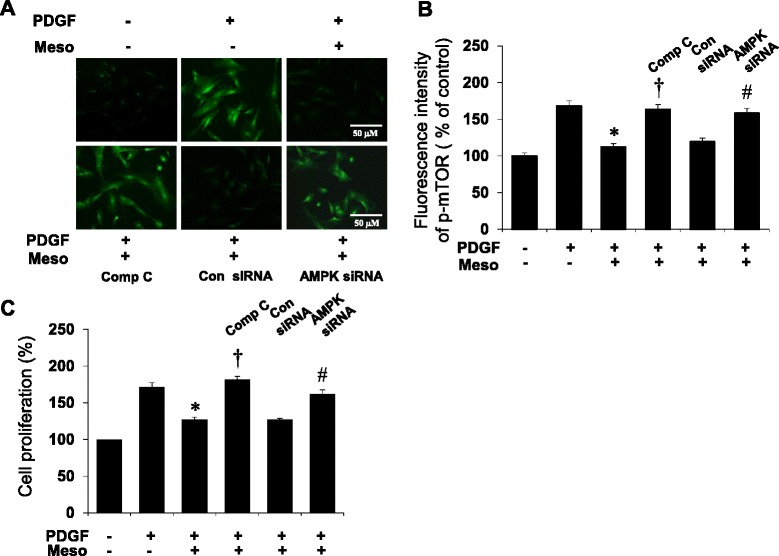
Fig. 5.

Localization and flow cytometric analysis of p-mTOR proteins and cell proliferation regulated by mesoglycan in VSMCs. Cells are stained with phosphorylated mTOR (green). All photographs are taken under confocal laser-scanning microscopy. VSMCs treated with compound C and AMPK siRNA show more mTOR phosphorylation (a). Flow cytometric intensity of p-mTOR protein in VSMCs. p-mTOR level was detected with p-mTOR antibody and the results were analyzed by FACS. Fluorescence intensity is geometric mean fluorescence. Each percentage is based on 1000 cells (b). Cells were stimulated with PDGF for 24 h and then treated with compound C (10 μM) or transfected with AMPK siRNA in the presence of mesoglycan. Cell proliferation was determined by the MTT assay (c). Representative results from three independent experiments were shown. *p <0.05 versus PDGF, † p <0.05 versus PDGF + Meso, # p <0.05 versus control siRNA
