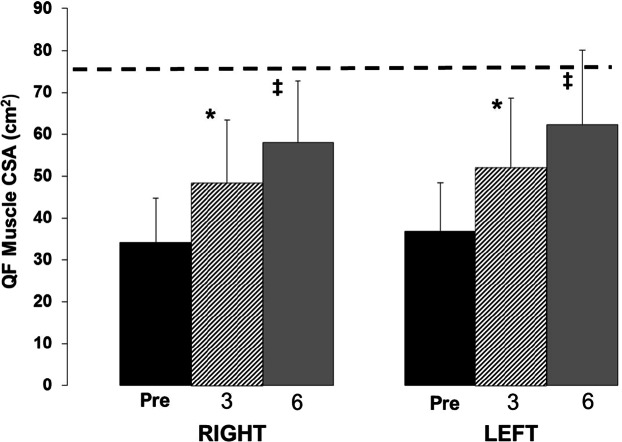
Figure 4.
The progression of muscle hypertrophy as measured with MRI over 6 months using the Dudley protocol. Hatched line indicates the average able-bodied muscle size as reported by Castro et al.4 The asterisk indicates a significant increase from baseline and the double dagger indicates a significant increase from 3 months (P < .05). CSA = cross-sectional area; QF = quadriceps femoris.

