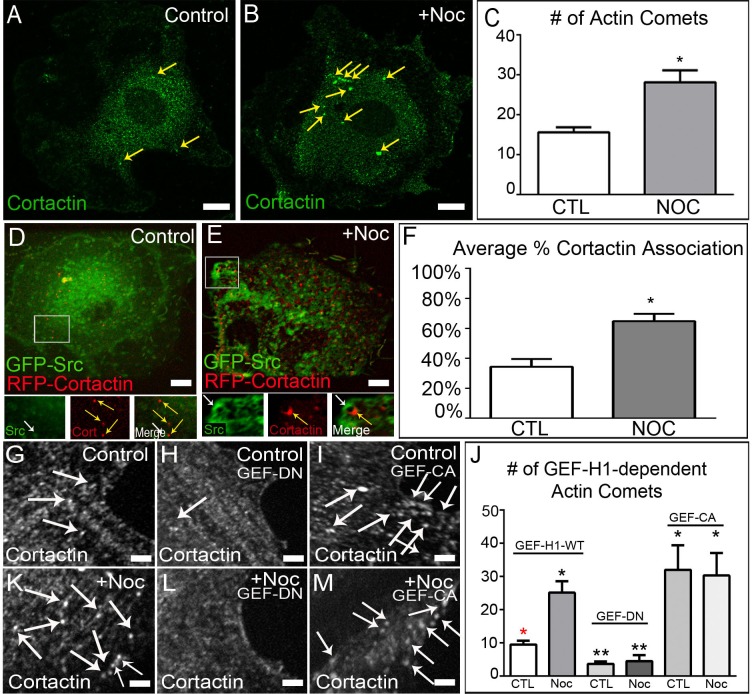
Fig 2. GEF-H1 regulates formation of actin comet tails at c-Src vesicle membranes.
(A-B) Control and nocodazole-treated A7r5 cells fixed and stained for cortactin (green). Immunostaining. Bar, 5μm. (C) Quantification of actin comet tail formation in control and nocodazole-treated cells reveals a two-fold increase upon MT depolymerization. Representative examples out of 30 cells/condition. Error bars indicate s.e.m. (D-E) Live-cell imaging of control and nocodazole-treated A7r5 cells expressing GFP-Src and RFP-Cortactin. Area in box is enlarged below. Bar 5μm. See also S3 Movie. (F) Quantification reveals that MT depolymerization induces increased actin comet formation at c-Src vesicle membranes. (G and K) Z-section of A7r5 cells expressing wild-type GEF-H1 pre- and post-nocodazole fixed and immunostained for cortactin. Images illustrate an increase in cortactin puncta (white arrows) following MT depolymerization Bar, 5μm. (H and L) Z-section of A7r5 cells expressing dominant-negative GEF-H1 pre- and post-nocodazole demonstrates the role of GEF-H1 in forming actin comets. Bar, 5μm. (I and M) Z-section of A7r5 cells expressing constitutively active GEF-H1 pre- and post-nocodazole show high number of actin comets in the presence or absence of MTs. Bar, 5μm. (J) Quantification of actin comet tail formation after expression of various GEF-H1 constructs. Representative examples out of 30 cells/condition. Error bars indicate SEM. Asterisks indicate p-value < .05.

