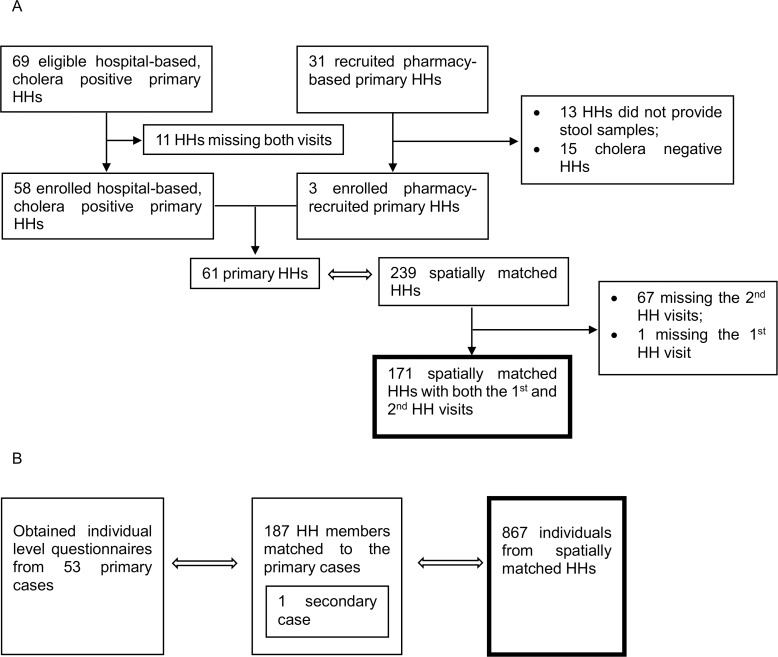
Fig 1. A flow chart outlining the enrolled households and individuals and those eligible for the study.
A) For all household level exposures, only the data from the 171 spatially matched households participated in both household visits were considered. B) For analyses of individual level exposures, only the data from the 867 individuals in spatially matched households were considered.

