
Fig. 1.
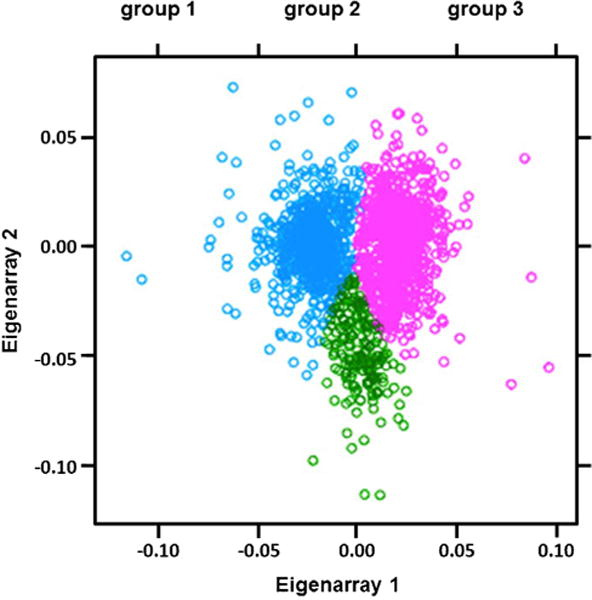
Correlation analysis. Clustering the first two eigenarrays suggested that three distinct gene groups (total of 795 genes), had correlated expression throughout all the microarrays.
Official websites use .gov
A
.gov website belongs to an official
government organization in the United States.
Secure .gov websites use HTTPS
A lock (
) or https:// means you've safely
connected to the .gov website. Share sensitive
information only on official, secure websites.
Correlation analysis. Clustering the first two eigenarrays suggested that three distinct gene groups (total of 795 genes), had correlated expression throughout all the microarrays.