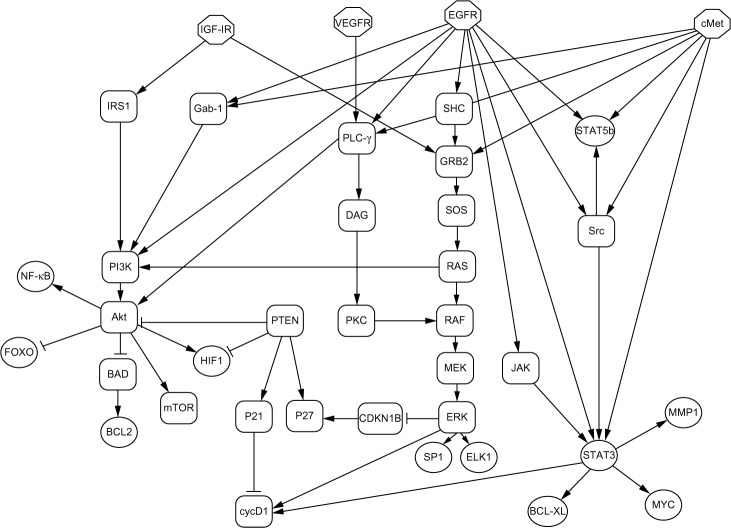
Figure 1.
Diagram of the signaling network involved in HNSCC. The root nodes (octagons) of this diagram represent the receptors that are activated and then drive the rest of the network. The leaf nodes (circles) represent the TFs that activate a large number of genes involved in HNSCC. A pointed arrow represents activation of the target and a T represents repression of the target. Rounded rectangles represent signaling proteins.

